Hello and Welcome! Scroll down to continue.
This is a self-guided introduction to Risk Terrain Modeling and RTMDx software. For questions or assistance email [email protected]
Section 1: Risk Terrain Modeling
Specific Instructions: Click to expand each sub-section, then read, watch or review the content.
1.1: What is Risk Terrain Modeling?
RTM diagnoses environmental conditions that lead to crime (and other problems).
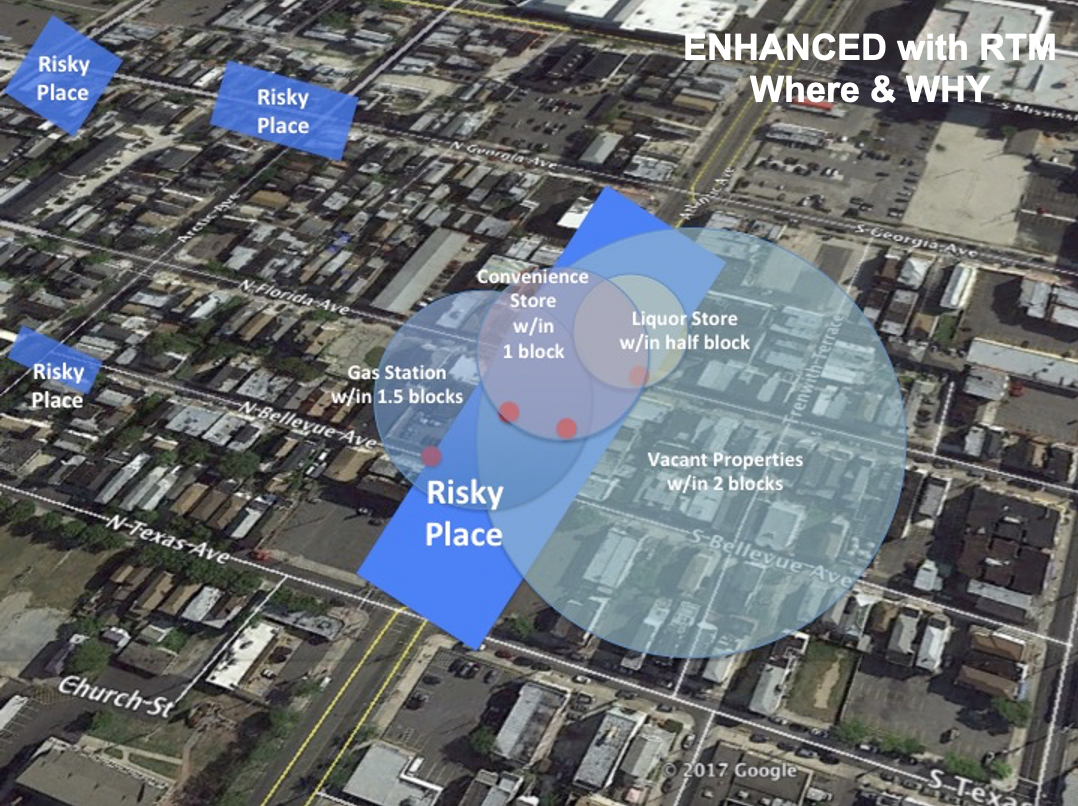
RTM doesn’t just tell you where crime is happening, it also tells you why. It adds the why to the where.
RTM lets you focus on places, not people.
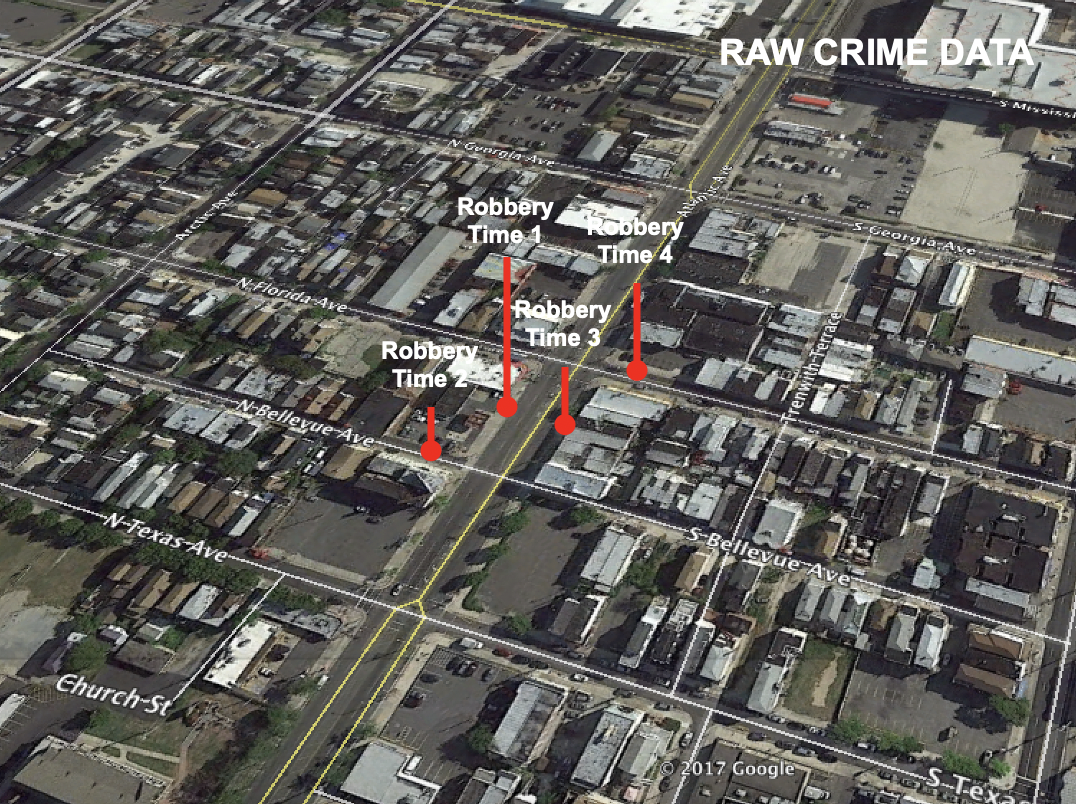
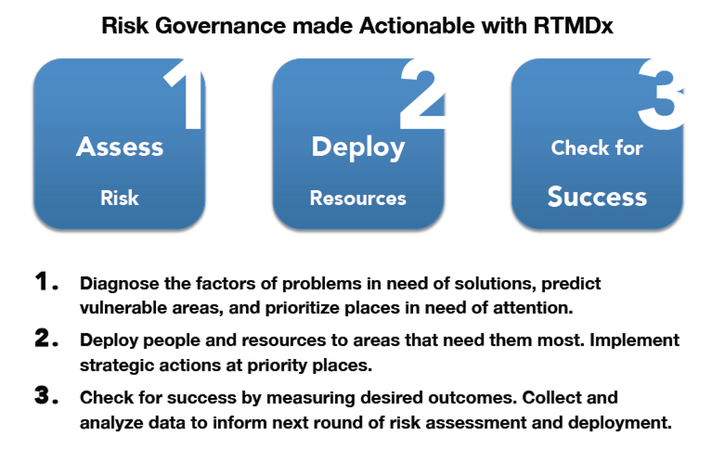
As shown in the graphics below, RTM analyzes the spatial patterns of crime incidents to determine how the built environment influences criminal behaviors that lead to crime outcomes at the same places over-and-over again. This adds meaningful context to raw crime data. And, diagnosing crime hot spots with RTM gives you accurate forecasts of where and why problems will persist or emerge because of the environmental conditions located there.
1.2: RTM Intro Video
1.3: Sample RTM Reports
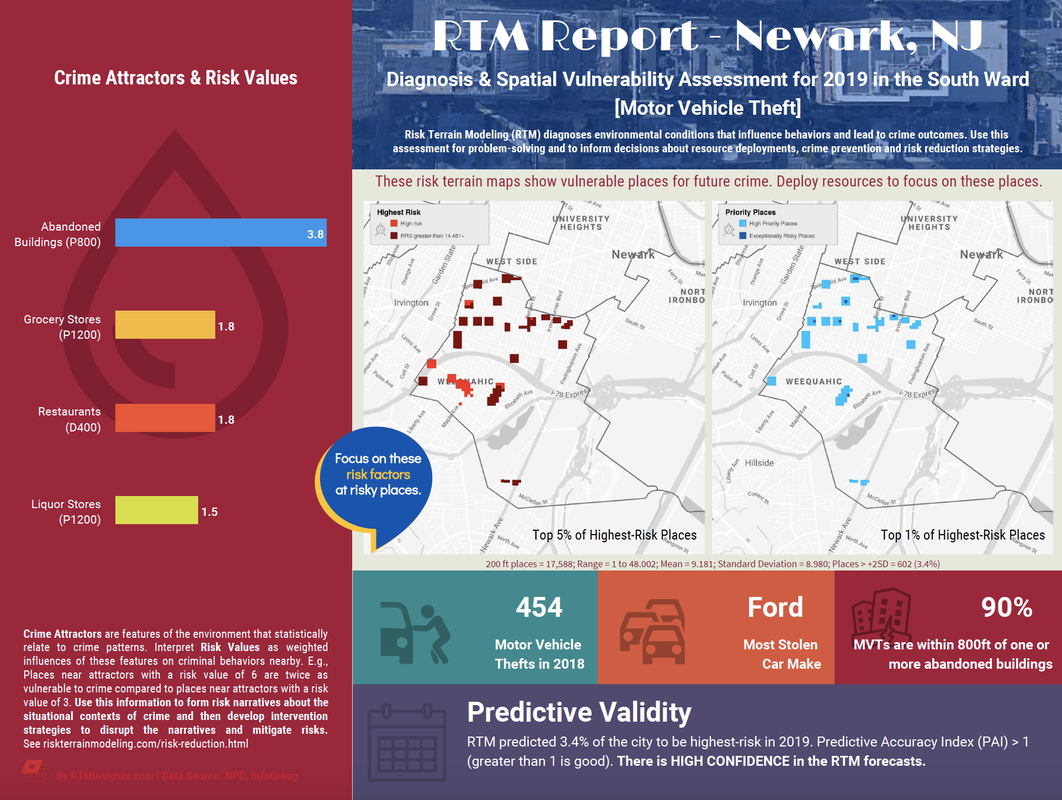
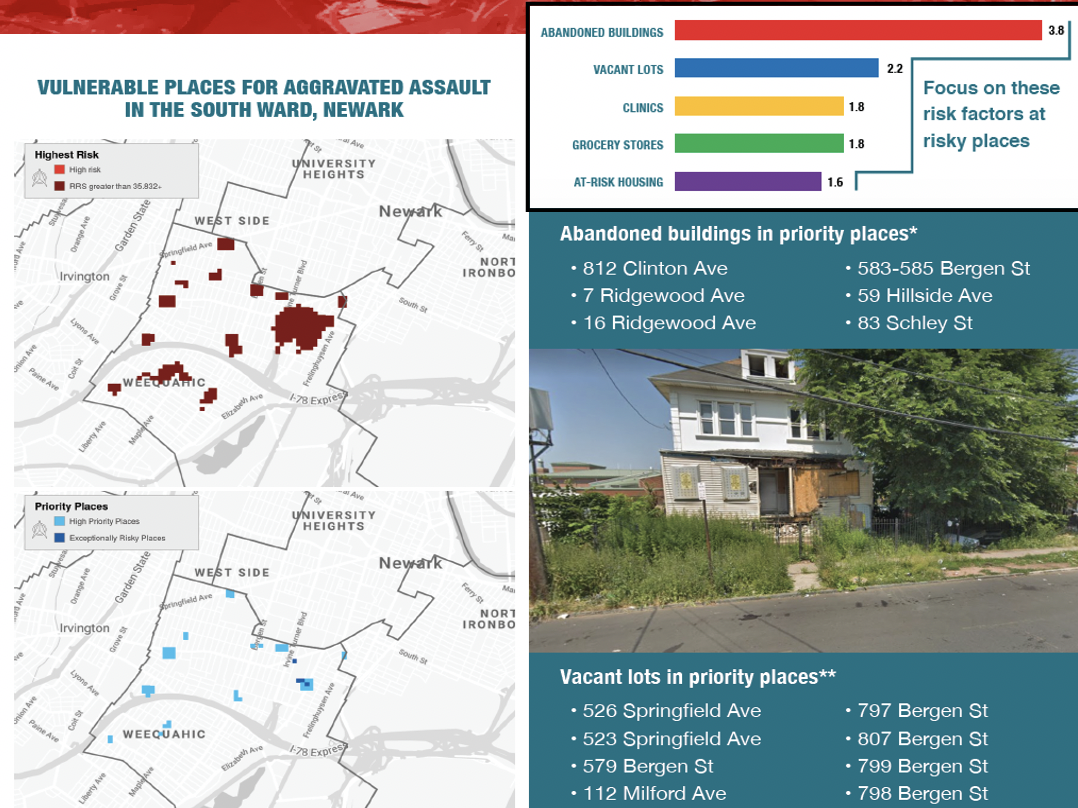
These are just two of many different examples and formats of RTM reports that are possible.
These reports were produced for the Newark Public Safety Collaborative. Knowing where to go and what to focus on when you get there makes crime prevention initiatives efficient and effective. And you can coordinate resources beyond only policing and law enforcement. You can partner with other city agencies and community groups to help them prioritize places that need them most.
These reports were produced for the Newark Public Safety Collaborative. Knowing where to go and what to focus on when you get there makes crime prevention initiatives efficient and effective. And you can coordinate resources beyond only policing and law enforcement. You can partner with other city agencies and community groups to help them prioritize places that need them most.
1.4: Focus on Places, Not People, to Prevent Crime
This TEDx talk introduces early applications of RTM research that led to risk-based policing and then data-informed community engagement.
1.5: Research Evidence
|
Risk Terrain Modeling represents a significant investment of over 40 years of rigorous research, systematic investigation, fieldwork and professional experience. It has been independently proven and tested in over 45 countries across 6 continents around the world and most states in the United States. It has a proven track record with successful outcomes that reflect community priorities.
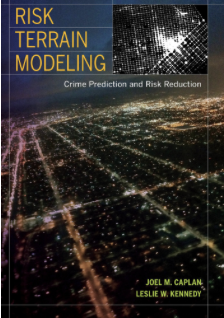
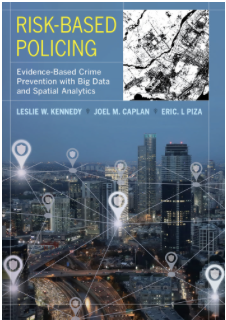
Visit www.riskterrainmodeling.com/rtmworks.html for a full list of current publications and research on RTM. The book, Risk Terrain Modeling: Crime Prediction and Risk Reduction, presents a detailed discussion on how RTM diagnoses the spatial attractors of criminal behavior, how it makes accurate forecasts of where crime will occur at the microlevel, and how to design interventions to reduce risks. The book, Risk-Based Policing: Evidence-Based Crime Prevention with Big Data and Spatial Analytics, discusses ways for police departments to use RTM and be accountable to community needs in transparent and effective ways that prevent crime and enhance public safety. Risk-based policing helps police share the burden of crime prevention with multiple stakeholders, and to coordinate these efforts in ways that maximize existing local resources. The free 31-page eBook, Operation Safe Surroundings (OpSS), presents an effective and sustainable approach to problem-solving with Data-Informed Community Engagement (DICE). DICE uses RTM to diagnose crime problems, form risk narratives, and develop place-based strategies to disrupt the narratives with coordinated responses by multiple stakeholders and resources. |
Section 2: RTMDx Software
Specific Instructions: Click to expand each sub-section, then read, watch or review the content.
2.1: Software
|
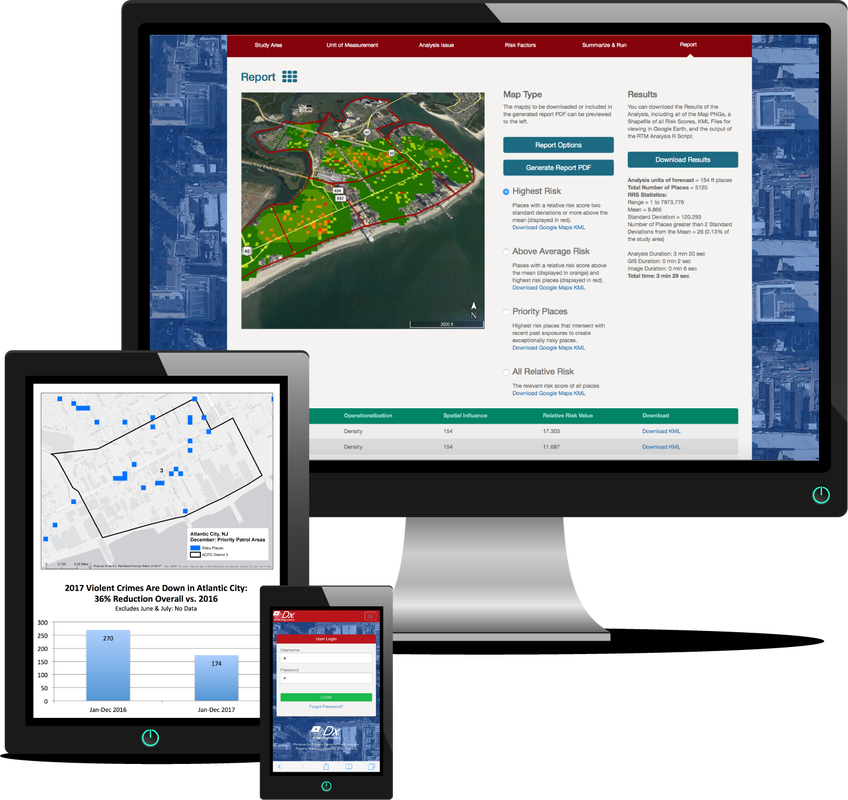
RTMDx is the software solution that automates RTM analyses. It was originally developed at Rutgers University to help make Risk Terrain Modeling (RTM) easy and accessible to everyone. It quickly produces clear reports and maps that inform decision-making and helps solve problems.
Visit the software page for more information. |
2.2: Distribution
RTMDx software is available from Rutgers University exclusively through Simsi, Inc. Student users can access RTMDx at the discounted educational rate. Subscription options are also available for individual, agency and enterprise users. For additional assistance email [email protected]
2.3: Transparency Under-the-Hood
Subscription to the software includes full-transparency of the statistical processes under-the-hood. RTMDx runs on Risk Terrain Modeling (RTM) methods, which have been rigorously tested on a variety of topics in multiple US jurisdictions and around the world. RTM is widely cited in peer reviewed publications, and the RTMDx software invites checks by human operators at multiple stages of analysis, from data inputs to map outputs. RTMDx produces reliable and actionable results that meet community expectations. Confidently make decisions that are evidence-based, transparent and accountable.
2.4: Tables & Maps
Actionable intel comes from RTM tables and maps.
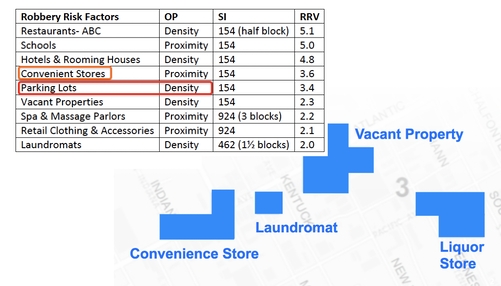
Tables show crime attractors, which help you decide what factors to focus on that connects with criminal behavior. And the relative risk values (RRVs) allow comparisons across risk factors to help prioritize prevention efforts. They also show what is not particularly important (by their omission). This can inform decisions to stop paying attention to factors that were once thought to be important, but aren’t, and focus attention on the spatial factors that truly correlate with criminal behavior, but might have been previously overlooked.
You can also learn how risk factors influence behavior and the extent of this spatial influence. E.g., We might have assumed that parking lots relate to robbery. But it’s not proximity to any parking lot that heightens risk, it’s only areas with high concentrations of parking lots that attract robbery incidents and, therefore, pose more than 3 times greater risk of robbery than elsewhere in town.
In addition to this, we can also consider timing, to determine, for instance, that schools or parking lots are only risky at certain times of the day (in the same way that bars might have a different spatial influence at 10pm on Fridays compared to 10am on Tuesdays, for example).
All of this information from RTM lets us problem-solve better than we might otherwise.

